Working through ATAC-seq data analysis, Part 1: From public data to raw-read QC
Most of my sequencing work so far has been with nanopore RNA data and bacterial genomes. I believe these skills are transferable to other genomics analyses, but I wanted to get used to working with different types of sequencing datasets. Towards this goal, I decided to work through a minimal ATAC-seq dataset and write a series of posts, with each post covering one stage of the analysis.
For this first part, I downloaded four mouse ATAC-seq libraries from a published study Chronic cAMP activation induces adipocyte browning through discordant biphasic remodeling of transcriptome and chromatin accessibility. Following this, I checked the paired-end FASTQs, ran FastQC and brought the reports together in MultiQC.
Starting with the comparison
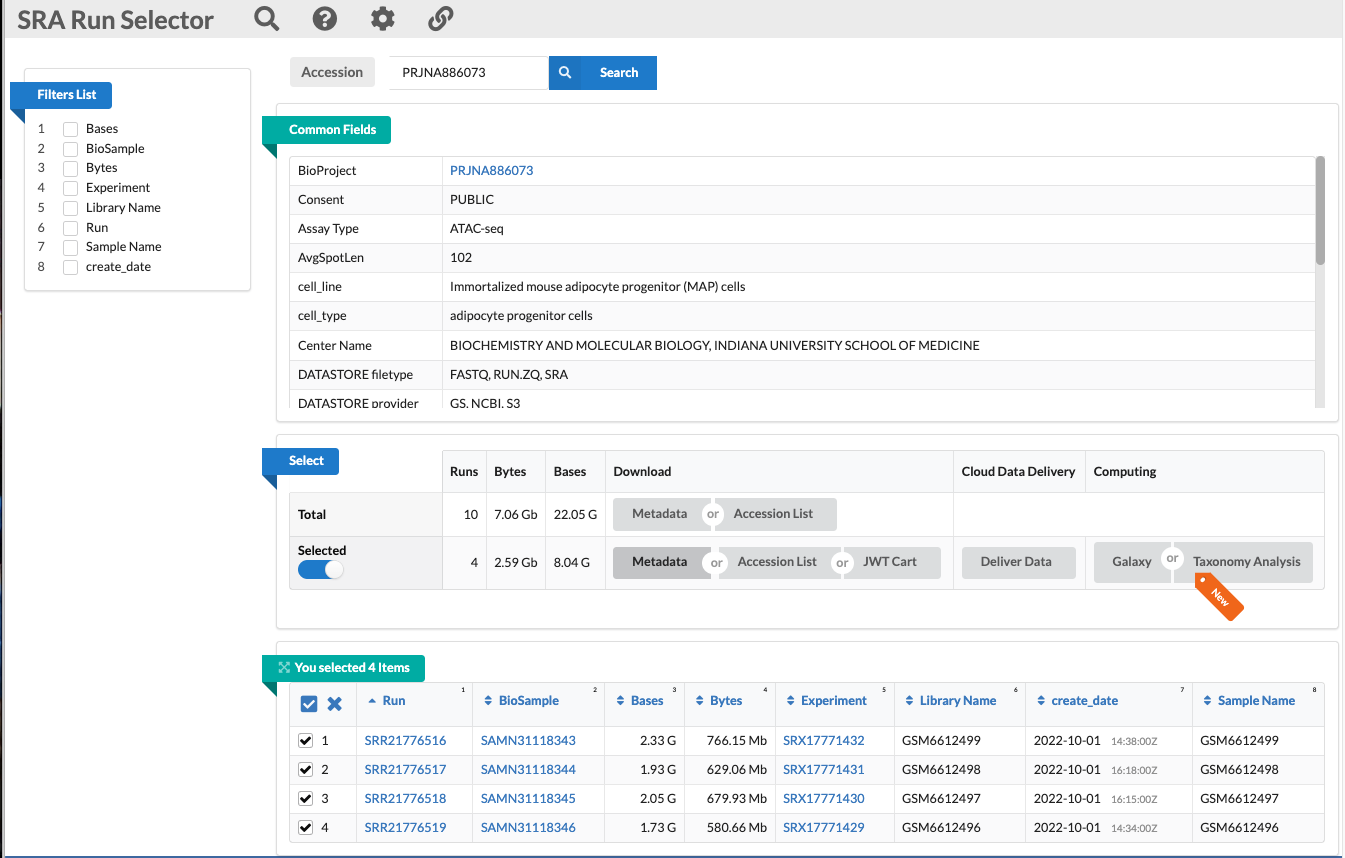
I chose GSE214597 on GEO, a study of chromatin accessibility following forskolin or rosiglitazone treatment in an immortalized mouse adipocyte progenitor (MAP) cell line. The study contains ten samples across five groups. I wanted to start with one treatment and one time point. So, I selected the two vehicle controls and the two samples treated with forskolin for four hours.
The question I want to answer is: which genomic regions become more or less accessible after four hours of forskolin treatment? I downloaded the full libraries for this comparison, without downsampling.
ATAC-seq uses Tn5 transposase to cut and attach sequencing adapters to accessible DNA. Where those fragments map helps us infer chromatin accessibility. Having worked in both the wet lab and bioinformatics, I find it easier to understand the data when I know the experimental design and protocol. I found the ATAC-seq protocol by Buenrostro and colleagues helpful.
There are two biological replicates per condition in this comparison. Millions of reads give me sequencing depth, but the biological replication is still two samples per group. That will matter when I eventually reach differential accessibility analysis.
Keeping the sample identities straight
Before downloading, I worked through the relationship between the GEO and SRA accessions. For the first control, it is:
GSE214597 → GSM6612496 → SRX17771429 → SRR21776519 → R1 and R2 FASTQs
study       sample        experiment    sequencing run
The run accession is what I give to the download tool. The sample record tells me what that run represents biologically. An experiment can have more than one run, although here I selected one run for each sample.
This is the mapping I used throughout:
| Local sample name | Condition | GEO sample | SRA run |
|---|---|---|---|
control_1 |
Vehicle, replicate 1 | GSM6612496 | SRR21776519 |
control_2 |
Vehicle, replicate 2 | GSM6612497 | SRR21776518 |
fsk4h_1 |
Forskolin 4 h, replicate 1 | GSM6612498 | SRR21776517 |
fsk4h_2 |
Forskolin 4 h, replicate 2 | GSM6612499 | SRR21776516 |
I initially called the treated libraries sample_1 and sample_2, then changed them to fsk4h_1 and fsk4h_2. It is a small change, but a report is much easier to read when the filenames tell me which treatment I am looking at. The accession mapping still needs to stay alongside those names; descriptive filenames cannot replace the metadata.
One detail in the SRA metadata was an average spot length of 102 bases. For these paired-end libraries, that turned out to be 51 bases in R1 and 51 in R2. I checked this against the actual FASTQs below. It does not mean that each read is 102 bases long, or that the original DNA fragments are all 102 bp.
Getting from SRA to FASTQ
I ran the analysis on an Azure instance using a separate Conda environment called atacseq. For this stage I used SRA Toolkit, SeqKit, pigz, FastQC and MultiQC. I also installed Bowtie2 and MACS3 for the alignment and peak-calling stages later in the series.
I separated the downloaded archives, raw FASTQs, metadata and QC reports:
atacseq_learning/
├── metadata/
├── sra/
├── raw_fastq/
└── qc/
    ├── fastqc/
    └── multiqc/
The commands below are a cleaned-up record of the steps, with paths relative to ~/projects/atacseq_learning.
cd ~/projects/atacseq_learning
mkdir -p sra raw_fastq qc/fastqc qc/multiqc

# Download the first control library.
cd sra
prefetch SRR21776519

# Convert the archive into separate files for the two mates.
cd ..
fasterq-dump sra/SRR21776519/SRR21776519.sra \
  --split-files --threads 8 --outdir raw_fastq
For this first library, fasterq-dump reported:
spots read   : 16,945,082
reads read   : 33,890,164
reads written: 33,890,164
That is 16,945,082 read pairs, with two reads per pair. I followed the same download and conversion procedure for the other three runs.
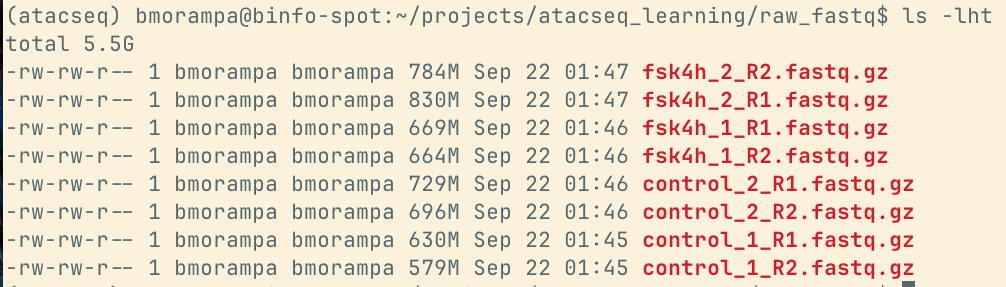
Disk space is worth checking before this step. The directory listing showed about 37 GiB of uncompressed FASTQs, compared with about 5.5 GiB after compression. The SRA archive sizes were smaller again. Conversion also uses temporary space, so the download size alone is not a useful estimate of the space the job will need. The SRA Toolkit documentation explains this distinction.
Checking what actually arrived
Before compression, I ran the extended SeqKit statistics command across all eight files:
cd ~/projects/atacseq_learning/raw_fastq
seqkit stats -a *.fastq
The counts were:
| Sample | R1 records | R2 records | Read length, each mate |
|---|---|---|---|
control_1 |
16,945,082 | 16,945,082 | 51 bp |
control_2 |
20,055,855 | 20,055,855 | 51 bp |
fsk4h_1 |
18,961,696 | 18,961,696 | 51 bp |
fsk4h_2 |
22,812,258 | 22,812,258 | 51 bp |
Across the four libraries, that is 78,774,891 read pairs, or 157,549,782 individual reads. The counts also agree with the SRA base totals divided by 102 bases per pair. For example, the first control has 1,728,398,364 sequenced bases: dividing by 102 gives 16,945,082 pairs.
I use the same check in other analyses: the read counts and lengths should agree with the metadata before I move on. Matching counts are useful, although they do not by themselves prove that every R1 identifier is paired with the correct R2 identifier in the correct order.
I then compressed the FASTQs with pigz:
pigz -p 8 *.fastqCompression is lossless; it preserves the sequences and quality strings. R1 and R2 can compress to different sizes even when their read counts are identical.
After renaming, these were the files I took into FastQC:
Bringing the QC reports together
I ran FastQC v0.12.1 on each FASTQ and used MultiQC v1.35 to compare the reports in one place:
cd ~/projects/atacseq_learning

fastqc raw_fastq/*.fastq.gz \
  --outdir qc/fastqc --threads 8

cd qc/fastqc
multiqc . --outdir ../multiqc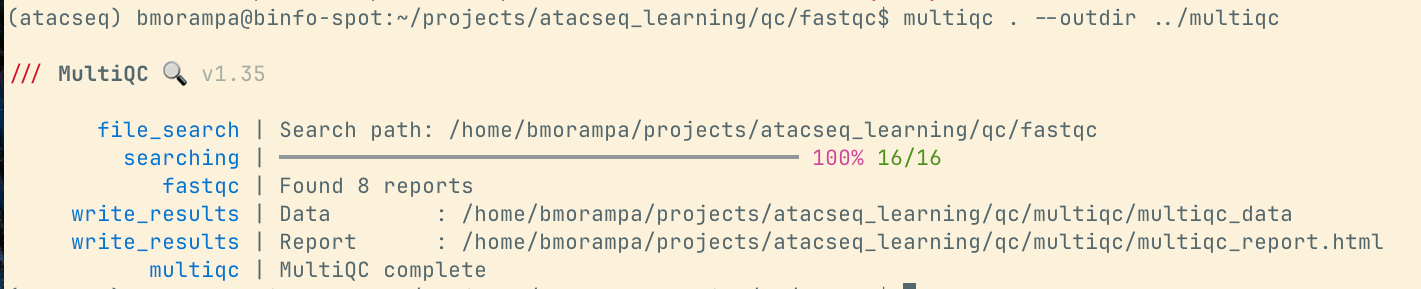
Those eight reports represent four libraries, each with two mates. FastQC measures properties of the reads, and MultiQC collects those measurements. Neither step removes reads or changes the FASTQs.
Open the original MultiQC report to inspect the sample statistics, plots and module flags discussed below. This is the report generated from these eight raw FASTQs.
Reading the warnings in the context of ATAC-seq
Running FastQC was familiar. I spent more time working out what the warnings meant for ATAC-seq and whether I needed to do anything about them. These are the results from that report. I checked the read counts against the earlier SeqKit output as well and they agree for all eight files.
| Check | What the report showed | What I took from it |
|---|---|---|
| Per-base quality | All eight files passed; positional mean Phred scores ranged from 33.54 to 36.26 | No clear case for routine quality trimming from this check |
| Per-base sequence content | All eight files failed | Consider the library preparation and Tn5 bias before cutting bases off |
| Sequence duplication | All eight warned; approximately 31–36% | Revisit duplication using mapped paired-end fragments |
| Adapter content | All eight passed; maximum Nextera signal ranged from 4.08% to 4.94% across files | A pass flag does not mean adapters are absent |
| Per-sequence GC content | Both control_1 mates warned; the other six files passed |
Keep this sample under observation in later QC |
| Overrepresented sequences | All eight passed | No flag from this module |
A sequence-content failure needs an explanation
FastQC checks whether base proportions differ across read positions. ATAC-seq uses a transposase with sequence preferences, so I should not assume the reads start at random sequences. FastQC’s own sequence-content documentation describes this issue for transposase-fragmented libraries.
That makes Tn5 bias a plausible explanation for the flags. It does not establish that Tn5 is the only cause in these samples. The failure alone is not a reason to trim a fixed number of bases from the start of every read, especially when the reads are only 51 bases long.
Sequence duplication is not a PCR-duplicate measurement
The roughly 31–36% duplication estimates also need care. FastQC looks for repeated sequences within each read file. It cannot tell me, from those sequences alone, which repeats arose through PCR and which represent independently sampled molecules. The FastQC duplication documentation makes that limitation explicit.
ATAC-seq enriches accessible regions, so repeated sequences need to be interpreted in that context. I will assess mapped duplicate fragments and library complexity after alignment.
Adapters can be present even when the module passes
The Nextera adapter signal reached approximately 4–5% towards the read ends. FastQC only issues an adapter-content warning above 5%. So, these files passed even though adapters were detected.
This is consistent with some reads extending through short inserts into adapter sequence. My next step is conservative adapter trimming, followed by another QC check. I do not see a reason in the quality profiles to add routine quality trimming or fixed trimming of the first bases.
The GC warning is still on my list as well. The reported overall GC values were similar, around 48–49%, but a similar average does not guarantee a similar distribution. I will check whether control_1 also stands out in the mapping results and other library metrics. I cannot diagnose contamination from that warning alone.
Where I am stopping for this part
My decision was to retain all four libraries for the next stage and trim adapters before alignment. At this point, trimming is planned, not completed.
Good base quality is encouraging, but there is more to an ATAC-seq library than readable sequence. After alignment, I still need to examine mapping rates, mitochondrial reads, duplicate fragments, fragment-size patterns and enrichment around transcription start sites. After peak calling, I can look at the fraction of eligible fragments falling within peaks and assess replicate agreement. These are among the checks described in the ENCODE ATAC-seq guidance; they are not measurements I have made yet.
The planned reference is mouse mm10/GRCm38. Before using it, I will need to make sure the genome, annotation and any exclusion regions use compatible coordinates.
The steps so far are similar to the Illumina bulk RNA-seq analyses I have worked on before. I still start by understanding the biology and experimental protocol, checking the sequencing platform and file formats, and tracing the files back to the samples. The part I need to get used to is interpreting the QC results for ATAC-seq.
The next post will cover adapter trimming and alignment. I will keep the raw FASTQs so I can compare the data before and after processing.